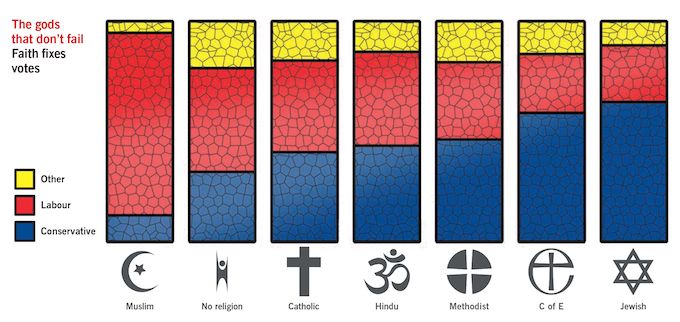
The old quip ran that the Church of England was “the Conservative Party at prayer.” With 58 per cent of Anglicans voting blue in 2017, Theresa May, the daughter of a C of E chaplain, had them as tightly locked down as ever. Her problem is that there are many fewer Anglicans these days. Non-conformists, by contrast, used to be a major bloc in radical politics, but last year the UK’s remaining Methodists plumped for May over Corbyn, 47 to 35 per cent. Catholics, meanwhile, retain their historic preference for Labour, but only just—by 42 to 40 per cent.
But in a diverse land, what’s just as important as Christian votes are votes from those of other faiths—and no faith at all. Britain’s Jews were historically important movers in Labour, but they’re a more Conservative group today—preferring that party to Labour by 63-26. Even before Corbyn’s run-in with the Board of Deputies over anti-Semitism, a poll for the Jewish Chronicle recorded a stark Tory lean when Ed Miliband was still the leader.* The opposite pattern is found among Muslims—a crushing 85 per cent of whom went Labour last time. Other faiths lie in between, with Hindus for example split down the middle at 42-42. All of these minorities will be important in places, but none as much as the group that is now the largest of all—non-believers. In 2017, they split for Labour, by 47 to 32 per cent.
*The Jewish Chronicle’s pre-election polls are not directly comparable, but showed a 69-22 Conservative lead in 2015, which rose to 77-13 margin in 2017
SOURCES: POLITICAL NUMBERS FROM BRITISH ELECTION STUDY WITH THANKS TO BEN CLEMENTS AND ED FIELDHOUSE; ANGLICAN NUMBERS FROM BRITISH SOCIAL ATTITUDES