Of all Britain’s national obsessions, housing must surely top the list. Policymakers face a barrage of the same questions: are we building enough houses? And are they cheap enough for most people to afford? If you take a look at the bigger picture, you can see why we ask.
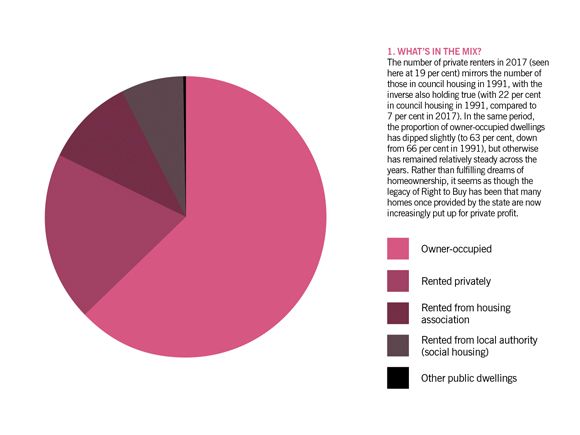
Today Britain’s housing mix remains largely dominated by owner-occupied dwellings (as it has done for some time) with the starkest changes occurring in the types of rented accommodation. As the first chart illustrates, private renters come in as Britain’s second largest category of tenant, taking the spot council housing once had in the early 1990s.
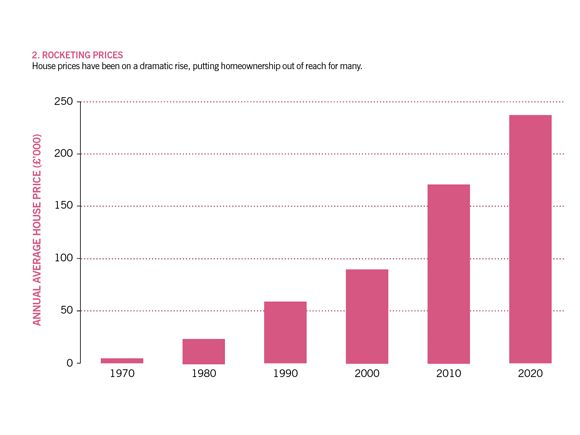
That the average house price has skyrocketed in the past 10 years will not surprise many of those cash-strapped private renters seeking to get a leg-up on the property ladder. Between 2010 and 2020 alone, as the second chart shows, the average annual house price increased by 39.5 per cent—which will make saving up for deposits that much harder.
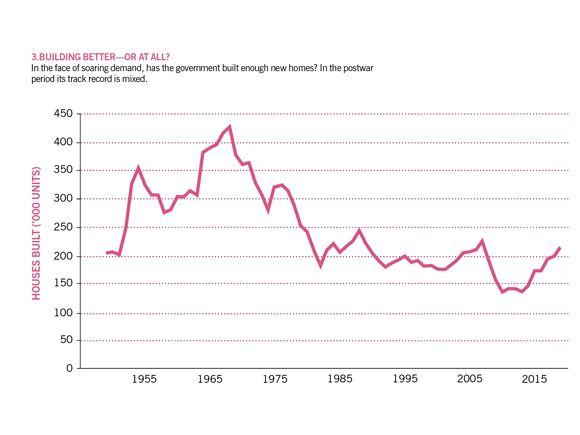
Meanwhile, as shown by the third chart, our track record of house building is mixed at best. After a surge during the immediate postwar period, house building has generally been on the decline for the better half of a century; even a more recent uptick has yet to make up for a steeper decline that took place in the early 2000s. Overall today’s housing landscape is riddled with financial and generational problems for potential homeowners, with few clear solutions in sight.
Sources: “Dwelling stock: by tenure” published May 2019 by gov.uk; UK house price index, uk land registry; “House building, UK: permanent dwellings started and completed,” published March 2021 by the ONS