Britain in 2011 was a better place to live than Britain in 1921. We know this because people, on average, live much longer now. In 1921, men in England and Wales had a life expectancy of 56 years and women of 60 years. Ninety years on the figures were 79 and 83 years for men and women respectively—a 23 year improvement in only 90 years; one year extra in lifespan for every four years that passed. It’s not that staying alive is everything—although it is a rather important precondition to doing anything else. Rather, I put such weight on it because it correlates with other measures of health, many of which we can’t measure so well.
A long-lived society tends to be a healthier society, and health, in turn, is a good reflection of how well a society is doing—better, I would argue, than GDP. In a flourishing society that is meeting the needs of its members, those members will generally have long and healthy lives. For example, it was clear that the Soviet Union and its client states in Central and Eastern Europe were not good places to live in the 1970s and 1980s because health was so bad. Year on year, life expectancy improved in “western” Europe and stagnated or sometimes declined in the east. Then, in Russia particularly, things got worse again. When the Soviet Union dissolved, average incomes went down, while the spread of incomes got wider, and life expectancy collapsed.
Happily, though, England and Wales have generally been part of that healthy trend in the west. But there are now two clouds over this rosy picture of health, and therefore society, improving ineluctably. The first is inequality. In the aftermath of the Grenfell fire in 2017, I noted that in the Royal Borough of Kensington and Chelsea, life expectancy for men in the area around Grenfell was 14 years shorter than in the plush parts of the borough, even though these were only walking distance away.
Standing, as it did, in the midst of London’s richest borough, Grenfell was an extreme manifestation of inequality—look at the profile of the people who died or were made homeless there. Overwhelmingly, they were minorities or migrants, and very often they were poor. But we see enormous gaps in longevity everywhere, linked to measures of affluence and deprivation; the more deprived the area, the shorter the life expectancy.
The second break on my enthusiasm is that overall improvement has stalled, markedly so. From 1921 to 2011, as I have said, life expectancy improved by an average of 0.25 years every year. But from 2011 to 2015, improvement in life expectancy had slowed to just 0.07 years each year in men and 0.02 in women; averaging across the genders, that implies lives are now lengthening by only 0.04 or 0.05 years annually overall, a rate of improvement that is over 80 per cent down on that witnessed over the preceding 90 years.
A steady increase that had gone on, then, almost uninterrupted for a century has now nearly ground to a halt. What makes this especially worrisome is that in the United States, the last couple of years have actually seen life expectancy get shorter. Is it possible that Britons could follow Americans and start dying younger?
Has life expectancy peaked?
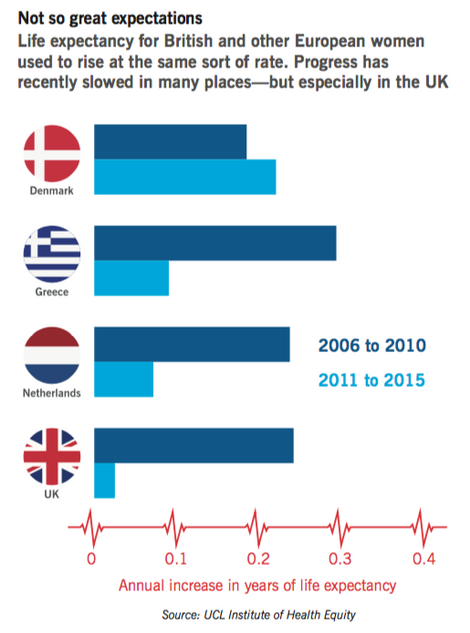
We are all mortal and so—goes one possible line of thought—perhaps the increase of life expectancy has to level off some time. Has the US, and perhaps soon the UK as well, simply reached peak life expectancy? One way of answering that question is to look at what has been happening in other European countries.The chart overleaf paints the picture, comparing the data for women in Britain with that for several other European countries over the last few years. (We focus on women alone for simplicity; most of the trends we discuss apply to men as well.) A few years ago, in the years 2006-10, the rise in life expectancy for women in Britain was in the middle of the European range—roughly a quarter of a year annually, the same as the Netherlands, a touch less in Denmark, and a touch more in Greece. But subsequently, in the years 2011-5, the picture diverges dramatically. In Denmark, we actually see an acceleration in improvement. In Greece, which suffered by far the most severe recession in Europe in these years, the rate of improvement slows distinctly, but remains in positive territory; much the same thing is true in the Netherlands, which might seem a more natural comparator for the UK. It is only in Britain that progress virtually stalls.
Of course, the chart only shows a handful of countries, but the unsettling message stands up when we review the data right across the continent, in 25 European Union states. While there has been a general tendency for progress in life expectancy to slow, Britain stands out in the striking nature of the slowdown. In the second half of the last decade, the rate at which lives were lengthening in the UK put them bang in the middle of the European pack. But during the years 2011-5, it tumbled down this table. The lifespans of British men are now rising more slowly than those in all but one of the other countries; and the longevity of British women is now rising more slowly than those in any of the other 24 countries studied.
The clouds I discern over the longevity landscape—the failure of life expectancy to continue its historic improvement, and inequalities—may be linked. In my book, The Health Gap, I lay out the evidence for the ways that social disadvantage can translate into heath disadvantage. The social gradient in health results from accumulation of advantage and disadvantage acting through the life course. Such disadvantage can be in material conditions—food, shelter, environmental exposures; or acting through the mind on behaviours and stress pathways. While it can be difficult to say which among these causes is responsible for a particular instance of ill-health, the pattern is clear: the lower the position on the social hierarchy, the worse the health.
Last year, Public Health England published data for trends in life expectancy for every local area in the country. It shows life expectancy actually declining in the northeast, Merseyside, Derbyshire, Nottinghamshire, Staffordshire, the West Midlands, parts of Kent—and continuing to improve in London and the southeast. A first pass through these data suggests inequalities in health between rich and poor areas are increasing. A March 2018 report from the Office for National Statistics confirms that inequalities in life expectancy and healthy life expectancy increased in the period 2014-16 compared to the previous three-year period.
It is cold comfort, but we are not alone. In the US where, as I have said, nationwide life expectancy has declined two years in a row, the overall rise in mortality rates are unequal, affecting different parts of society in very different ways. Beware, of course, of making too much of short-term fluctuations—twice may be a coincidence, but three times would start to look like a trend.
Yet even the possibility that American lives might be getting shorter is remarkable. Ordinarily in modern and prosperous societies, life expectancy has moved only one way—not least because the forward march of modern medicine is ceaseless. A sustained decrease in life expectancy, if that is what the US ends up with, would be almost unprecedented in peace time—outside the calamity that happened in the former Soviet Union.
Further alarming detail was distilled from the American data in a compelling report. In a 2015 paper, Ann Case and Angus Deaton, economists at Princeton University, drew attention to the increase in mortality in non-Hispanic white men and women. The key components of that increase were poisoning from drugs and alcohol, suicides, and chronic liver disease, which is mainly alcohol-related. Case and Deaton labelled these “deaths of despair.” In a follow-up report it was clear that the fewer the years of education a group had, the steeper the increase in mortality.
It wasn’t just that the high school dropouts were suffering and university graduates continuing to improve, it was a graded phenomenon: less education translated into a steeper rise in mortality. Health inequalities were increasing. And these inequalities in deaths from drugs, alcohol and suicide are major contributors to the overall decline in life expectancy in the last two years.
Another approach to exploring the link between “deaths of despair” and economic forces was shown by Shannon Monnat of Penn State University, who mapped the distribution of deaths from drugs, alcohol and suicide. She found that the greater the economic distress of an area, the higher the mortality from these causes.
One fascinating aspect of her research in the Midwest was that the more local deaths were recorded from drugs, alcohol and suicide, the greater the increase in the Republican vote achieved by Donald Trump in 2016 over Mitt Romney’s score in 2012. The question arises as to whether the same despair that shows up in the mortality data also increases the receptiveness to the Trump message. Meanwhile, in the UK, those regions where life expectancy is falling are, on the whole, regions which voted for Brexit.
In the UK we do not have the same appalling toll of deaths from opioids, although alcohol-related deaths continue to be a problem. And the connection between economic distress and harmful self-medication has long been familiar over here. Think, for example, of the heroin epidemic which took hold in parallel with mass unemployment in cities such Glasgow and Liverpool in the 1980s, as well as in certain mining communities where men found themselves with their traditional identities shattered and little to do.
Unemployment is not the same issue today, but nonetheless we do still see higher mortality in areas of economic distress. It is instructive to review the evidence across time, as well as between different places. Younger adults are often especially exposed to economic vicissitudes, not least because of the “last in, first out” approach of many employers.
They are also, of course, generally much less likely to die of purely natural causes, or to die at all than the elderly. Until the mid-1980s there had long been, since the 1960s at least, a firmly downward trend in the number of deaths among young adults. And this applied, in broadly the same way, in both the north and the south.
Sometime around 1986, however—as unemployment hit three million, and the rise in income inequality picked up pace—something flipped. Over the next decade, which included another job-destroying recession in 1990-91, mortality among the 25-34 year-olds increased appreciably from around 6.5 per 10,000 to something over seven. Again, this change was—initially—seen in the north and the south alike. After the mid-1990s, however, trends in the two regions diverged.
In the south, which in these years enjoyed a resurgent service economy, mortality for young adults reverted to its historic trend. By contrast, in the north—where the recovery took longer to pick up pace, and where there were stubborn pockets of joblessness—more young adults continued to die, with mortality hitting a peak of around eight per 10,000 in 2002, roughly a fifth more deaths per 10,000 than was seen in the same age-group in the south at this time. After 2002, with jobs becoming more plentiful and benefits and tax credits providing more of a cushion in the north, the deaths of young adults eventually started to become rarer again, but—even so—the persistent gap with the south remained.
In summary, in the detailed mortality data of recent British history, one can see, writ large, the effect of scorched-earth industrial policies. Experience tells us that our society, our economy and policies that bear on them have substantial impact on health and life expectancy.
"Don't blame Tory cuts"
Whatever is happening today is different. The economy is much changed. Jobs are relatively plentiful, and deaths of young adults are, mercifully, not becoming more common in either the north or the south. If there is a new mortality problem, it is at the other end of the age range. But it is, nonetheless, sufficiently serious to put the brakes on a near-century of progress in life expectancy. Parenthetically, while I am focussing here on deaths at older ages, I note with some alarm the report from ONS that infant mortality rates in England and Wales have risen two years in a row.Last July, I wrote to the Health Secretary and said that this slowdown in improvement in health should be treated with the same seriousness as the NHS winter crisis. Then winter arrived and, predictably, we got our bed crisis. Rightly, it draws attention to stewardship and funding of the NHS. Unfortunately, it draws attention away from the underlying and fundamental issue of why the health of our nation has stopped improving.
If we seek both to understand and to change the world, we need to grapple both with short and longer-term patterns of health and life expectancy. For the longer term, whether they be social inequalities in health, linked to education and social standing; persisting north-south differences; or east-west differences across Europe, then my general thesis applies. Health, and health inequalities, tell us a great deal about the nature of society through the life course, from early childhood to older age.
For shorter term fluctuations, though—and let’s hope that the current slowdown is one—there may be other explanations. In the past, for example, the replacement of (poisonous) town gas with (non-toxic) natural gas reduced the rate of suicide by making it harder to accomplish in the home. If we are to keep an open mind in reading the life expectancy data, we need to be alert to the possibility that myriad factors could bear on it, in the short term in particular.
But we also need to be alert to the opposite trap, which some are falling into. Nigel Hawkes, writing in the Sunday Times last autumn, reacted to our report about slowing life-expectancy with a piece saying: “Don’t blame Tory cuts.” He “knew” that austerity was not to blame. It could have been a statistical blip, the “flu, growing obesity,” anything except public policy. When he was so open-minded about the other possible explanations, it was odd to have such certainty that one particular theory had to be wrong.
I was less certain. The slowdown in life expectancy, we know from the data, happened because, as I have said, of a rise in mortality at older ages. Two major changes affect older people particularly. First, it was the policy of the coalition government to be relatively miserly in funding the NHS. From 1997 to 2010, NHS funding grew at about 6 per cent a year on average in real terms. This was enough for the health service to improve on most available measures over these years, but it is not quite as generous as it sounds, because the population was ageing as well as growing; on a per-head basis the growth was more like 5 per cent.
Those underlying demographic pressures, indeed, are one reason why the total NHS budget has tended to rise by an average of nearly 4 per cent annually in real terms since its inception, and this has only rarely been sufficient to stop the service feeling stretched. During the 2010-5 parliament, by contrast, the per-head annual increase in the real NHS budget was just 0.3 per cent. For this year, the spend per person, was actually set to go down, until an emergency bailout in the autumn budget came to the rescue.
Second, and compounding the miserably stretched arithmetic, is the abject and increasing inadequacy of the care system. The adult component of social care spending decreased after 2009/10. At a time when the population over 65 grew by one sixth, NHS Digital numbers recorded a 25 per cent drop in the number of adults receiving social care over the years 2009-2014. When hospitals end up without care facilities to discharge people into, beds end up blocked and the whole NHS feels the squeeze. The combined pressures on healthcare and social care spending will have an adverse impact on quality of life of older people. Whether they were shortening the lives of older people was less certain, which is why I call for an investigation into it. What could be more important?
In her first speech as prime minister, on the steps of No 10, Theresa May pointed to the burning injustice of inequalities in life expectancy. In her words, at least, she is right—the problem is pressing, and political action can make a difference. Researchers at the University of Liverpool examined the gap in life expectancy from 1983 to 2015 between the most deprived 20 per cent of local areas in England and the average. The gap in life expectancy between the poor areas and the average were increasing up until 2003.
When the New Labour strategy kicked in, allowing for the fact it took a couple of years for the Blair government to turn on the spending taps and then a lag time for the effects to be felt, the gap narrowed. A different government changed direction and, after 2012, health inequalities again increased. This seems to suggest that social policy makes a difference. But seeing as there has been little sign of the May government reversing the post-2010 policy and budgetary changes, one must ask what, practically, she or her government plan to do about the injustice she highlighted. Nearly two years into her premiership, we have had few answers yet.
My argument that health, and the magnitude of health inequalities, tells us how we are doing as a society is part of a broader case made by many that GDP growth is not a good guide to social progress. And growth in GDP, at least on a per-person basis, has been nothing much to shout about over the last decade. The fact that health improvements have slowed and that health inequalities have again grown wider is, by contrast, an important and chilling warning sign about where society is headed.