As the person who chaired the British Polling Council/Market Research Society Inquiry into the failure of the 2015 election polls, I have been asked many times what the outcome of the snap election on Thursday will be. Yet my record of predicting election results makes me quite unsuited to answering this question— surprisingly for some, it seems. I went for a hung parliament in 2015, Remain in the EU Referendum, and Clinton in the US Presidential race, to name but a few of my more recent failures. So, your safest bet at this stage if you want to know the election result would be to add or subtract ~5 points from my prediction (which, for the record, is an 8-point lead for the Conservatives).
But I can perhaps comment more usefully on the matter of whether the pollsters have addressed what the Inquiry identified as the key problem with their methodology in 2015. This was that their samples were unrepresentative of the voting population: the procedures they used to recruit people into their samples simply resulted in too many Labour voters and too few Conservatives. The adjustment procedures they applied to the raw data didn’t fix this basic problem.
Now, to the uninitiated at least, this explanation may sound like stating the bleeding obvious, but there are many other things that can and do go wrong with polling: among them late swing, turnout weighting, deliberate misreporting, and herding. However, the evidence considered by the Inquiry suggested that, singly or collectively, these other factors contributed little or nothing to the polling miss. Unrepresentative samples was the problem.
So, have the pollsters managed to fix the leak in the pipe? The recent report of the British Polling Council shows that the pollsters have been busy experimenting with their methods to address the problems identified by the Inquiry. In particular, they have taken measures to increase the diversity of the people who make it into poll samples in the first place, as well as weighting their samples in new ways to account for persistent over-representation of certain demographic groups. These efforts are to be commended.
The problem for the pollsters, and for those who commission them, is that it simply is not possible to know whether the sampling problem has been fixed until the result of the election is known. Even then, it will not be a straightforward assessment. The only variable that matters for most people at this point in the campaign is vote choice and we won’t know this until the votes are actually counted (remember, even the exit poll can be wrong). Unsatisfying as this may be it is, after all, why we do opinion polls. If there were a reliable means of benchmarking polls before election day, why would we bother doing polls in the first place?
We can, though, obtain some insight into whether the polls have addressed the representative sampling problem by looking at a measure of political engagement that all polls ask—how likely respondents are to cast a ballot in the election. Pollsters collect this information so that they can filter out likely non-voters from their vote share estimate. Usually, they do this by asking respondents to rate how likely they are to vote on a 1 to 10 scale, with 1 indicating certain not to vote and 10 certain to vote.
Now, if we treat these answers as respondents’ subjective probabilities of voting, which seems reasonable, then we can take their weighted average as the poll estimate of turnout in the election. For the 8 polls published up to 4 June in this campaign, the average implied turnout on this measure was 87%, with a high of 91% and a low of 84%. These are clearly a huge over-estimates (for comparison, turnout in 2015 was 66%).
Moreover, the changes pollsters have made to their methods for this campaign appear to have had no real effect on this indicator of political engagement— the corresponding figure for the 2015 polls was 88%. A sample skew toward politically engaged voters would still seem to be a problem in 2017.
Now, on its own, this is not the measure of turnout that pollsters use to filter out non-voters. Most use it alongside demographic modelling, or supplemented by questions on voting in previous elections. These adjustments make implied turnout lower than the figures I have presented here. Modifications have also been made to weighting procedures so that samples better represent the voting population in terms of education and political interest.
Will these changes prove sufficient to fix the representative sampling problem identified by the polling inquiry? I’ll get back to you on June the 9th.
I chaired the 2015 polling inquiry—here’s my take on this year’s polls
Pollsters have made various tweaks. On Friday, we'll know which (if any) worked
June 07, 2017

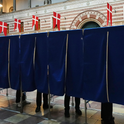
A polling station in Ely, Cambridgeshire. Photo: PA